

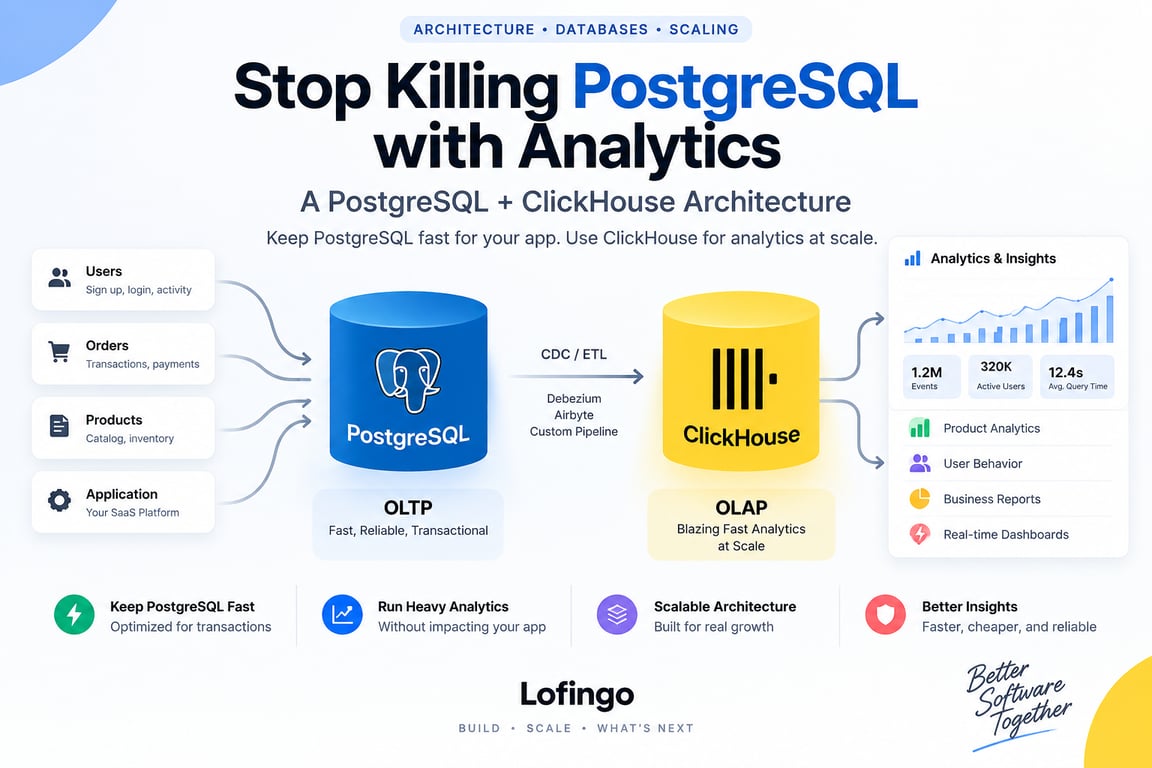
Stop Killing PostgreSQL with Analytics: A PostgreSQL + ClickHouse Architecture
PostgreSQL is an excellent transactional database. It can comfortably power APIs, user accounts, orders, billing records, configuration, search filters, background jobs, and plenty of reporting.
The problem usually starts much later.
A few dashboards become dozens. A few thousand rows become hundreds of millions. Product teams add longer date ranges, more filters, more breakdowns, more real-time charts, and more scheduled reports. Queries that were once harmless begin scanning large portions of tables and grouping millions of rows while the same database is still expected to process latency-sensitive application traffic.
At that point, the problem is not that PostgreSQL suddenly became a bad database.
> The problem is that one database is being asked to behave like both a transactional engine and an analytical warehouse at the same time.
That is where a PostgreSQL + ClickHouse architecture can become useful.
PostgreSQL Is Not the Problem
It is easy to jump too quickly from “this dashboard is slow” to “we need ClickHouse.” That is usually a mistake.
PostgreSQL can handle a surprising amount of analytical work, especially when:
- the dataset is still manageable
- indexes match the important filters
- reports are not constantly refreshing
- query concurrency is moderate
- aggregations cover relatively small time windows
- materialized views can solve a few expensive calculations
- a read replica can isolate reporting traffic
For many systems, PostgreSQL alone remains the simplest and best architecture for years.
The important question is not:
> “How many rows do we have?”
It is:
> “Are analytical workloads beginning to interfere with transactional workloads?”
That distinction matters because there is no universal row count where PostgreSQL stops being enough.
OLTP and OLAP Want Different Things
Most application traffic is OLTP: Online Transaction Processing.
Typical OLTP operations look like:
SELECT * FROM users WHERE id = $1;

UPDATE subscriptions
SET status = 'active'
WHERE id = $1;

INSERT INTO payments (...)
VALUES (...);
These queries usually:
- touch a small number of rows
- depend heavily on indexes
- care about low latency
- run inside transactions
- require strong consistency
- execute very frequently
Analytics is different.
An analytical query might look more like:
SELECT
    date_trunc('day', created_at) AS day,
    country,
    plan,
    count(*) AS signups,
    sum(revenue) AS revenue
FROM events
WHERE created_at >= now() - interval '180 days'
GROUP BY 1, 2, 3
ORDER BY 1;
That query may need to:
- scan millions of rows
- read many columns
- aggregate large ranges
- sort intermediate results
- run for seconds instead of milliseconds
- execute concurrently for many dashboards
PostgreSQL can execute both types of queries. The issue is that they compete for the same resources.
How Analytics Starts Hurting PostgreSQL
The first symptom is often not a database crash. It is gradual interference.
1. CPU starts disappearing into reports
A heavy aggregation can consume substantial CPU while user-facing requests are waiting for the same machine.
2. Large scans pressure the buffer cache
Transactional workloads benefit when frequently accessed pages remain hot in memory. Analytical scans can pull large amounts of colder data through the system and reduce cache locality for operational queries.
3. I/O becomes unpredictable
Historical reports may read large table ranges from disk at the exact moment normal application traffic needs fast access.
4. Connection pools become busy
If every dashboard panel executes its own query, analytics can consume a surprising number of database connections.
5. Query latency grows with history
The product might be fast today, but every month adds more data. The query itself has not changed; the amount of work behind it has.
6. Teams start adding increasingly awkward optimizations
You may notice a pattern like:
slow dashboard
    ↓
add index
    ↓
add another index
    ↓
add materialized view
    ↓
add cache
    ↓
add special aggregation table
    ↓
add cron job to refresh it
    ↓
add another cache for that table
None of those techniques are bad individually. The warning sign is when the transactional schema is increasingly being redesigned around analytics rather than application correctness.
Measure Before You Split
Before introducing another database, prove that analytics is actually the bottleneck.
Useful signals include:
- query duration and p95/p99 latency
- rows scanned versus rows returned
- database CPU during dashboard traffic
- disk read pressure
- buffer/cache behaviour
- slow-query frequency
- connection-pool saturation
- lock or transaction contention
- report concurrency
- growth of analytical latency as data grows
Use PostgreSQL tools such as EXPLAIN (ANALYZE, BUFFERS) on representative queries and observe them under realistic traffic.
For example:
EXPLAIN (ANALYZE, BUFFERS)
SELECT customer_id, sum(amount)
FROM transactions
WHERE created_at >= now() - interval '90 days'
GROUP BY customer_id;
The goal is not to hunt for one large number. You are trying to understand whether analytical work is consuming enough resources to affect the rest of the system.
Where ClickHouse Fits
ClickHouse is a column-oriented analytical database designed for large scans and aggregations.
Instead of replacing PostgreSQL, a common architecture gives each database a clear responsibility:
Application writes
      │
      ▼
PostgreSQL
Transactional source of truth
      │
      │  CDC / logical changes
      ▼
ClickHouse
Analytical copy
      │
      ▼
Analytics API / dashboards / reports
The split is simple conceptually:
| PostgreSQL | ClickHouse |
|---|---|
| Transactions | Analytics |
| Operational CRUD | Large aggregations |
| Point lookups | Historical scans |
| Strong consistency | Fast analytical reads |
| Constraints and relational integrity | Column-oriented analytical storage |
| Current application state | Trends, cohorts, funnels, reporting |
A useful rule is:
> PostgreSQL owns the truth. ClickHouse answers expensive questions about that truth.
CDC Is the Important Part
Once two databases exist, the hardest question becomes:
> “How does ClickHouse stay synchronized with PostgreSQL?”
The answer is usually Change Data Capture (CDC).
PostgreSQL records database changes in its Write-Ahead Log (WAL). Logical decoding and logical replication can expose a logical stream of committed changes that downstream systems can consume.
Instead of repeatedly running:
copy every row from PostgreSQL every 10 minutes
CDC allows a pipeline to continuously process changes such as:
INSERT
UPDATE
DELETE
This reduces the need for expensive full-table synchronization and keeps analytical data relatively fresh.
But production CDC is not just “connect database A to database B.”
What a Production CDC Pipeline Must Handle
Checkpoints and restart safety
If the connector crashes, it must know where to resume rather than silently skipping changes or replaying an uncontrolled amount of history.
Replication lag
You should know how far ClickHouse is behind PostgreSQL.
A simple operational metric is:
latest committed PostgreSQL change time
-
latest applied ClickHouse change time
=
replication lag
A dashboard that is five seconds behind may be perfectly acceptable. A pipeline silently falling forty minutes behind is a production incident.
Updates and deletes
Append-only events are straightforward. Mutable relational tables are harder.
Your ClickHouse table design must deliberately account for records that can be updated or deleted instead of assuming every incoming row is permanently final.
Backfills
CDC handles new changes. You still need a safe method to move historical data when the analytical system is introduced or rebuilt.
Typical migration logic becomes:
1. capture a consistent historical snapshot
2. begin or preserve the change stream
3. load historical data
4. apply remaining changes
5. verify counts / key aggregates
6. switch analytical reads
Schema evolution
Columns change. Types change. Tables are renamed. New fields appear.
The replication pipeline needs a defined strategy for how schema changes move from PostgreSQL into the analytical model.
Reconciliation
Even reliable pipelines should be verifiable.
Periodically compare useful invariants such as:
row counts by day
sum of important amounts
max event timestamp
known checkpoint IDs
You do not want synchronization correctness to depend entirely on “the connector says healthy.”
Eventual Consistency Is Part of the Design
Once analytics are served from a replicated database, PostgreSQL and ClickHouse will not always show the same state at the exact same millisecond.
That means you must classify queries correctly.
A dashboard asking:
> “How many API requests did we serve today?”
can usually tolerate a small delay.
A workflow asking:
> “Has this payment already been refunded?”
probably cannot.
The first belongs naturally in an analytical store.
The second should generally read the transactional source of truth.
Do not route queries based only on which database is faster. Route them based on consistency requirements and workload shape.
Query Routing Should Stay Explicit
One of the easiest ways to create bugs is to hide the difference between PostgreSQL and ClickHouse behind a generic data-access layer and pretend they are interchangeable.
They are not.
A cleaner application boundary is something like:
Operational APIs
    └── PostgreSQL

Analytics APIs
    └── ClickHouse
Examples of PostgreSQL reads:
- current account state
- permissions
- billing status
- current inventory or balance
- records required inside a transaction
Examples of ClickHouse reads:
- 12-month trends
- top-N breakdowns
- event funnels
- usage analytics
- cohort analysis
- high-cardinality reporting
- large group-bys across historical data
That separation keeps consistency decisions visible in the architecture.
Do Not Copy the PostgreSQL Schema Blindly
A common mistake is treating ClickHouse as a read replica with a different logo.
PostgreSQL schemas are often normalized because normalization is useful for transactional correctness.
Analytical queries frequently benefit from more query-friendly representations.
For example, a transactional model may contain:
orders
customers
products
regions
plans
An analytics model may intentionally duplicate some dimensions into the fact data so common queries do not need large relational joins repeatedly.
The analytical schema should be designed around questions you actually ask:
Which dimensions appear in filters?
Which columns appear in GROUP BY?
What time range is normally scanned?
Which events are immutable?
Which records can change later?
ClickHouse performance depends heavily on table design, sort order, partitioning choices, and query patterns. Do not assume that migrating the exact PostgreSQL schema is the optimal analytical model.
A Read Replica May Be Enough
Before running a new database technology, consider whether a PostgreSQL read replica solves the actual problem.
A replica can be a strong option when:
- reporting queries are moderately expensive
- the relational model is still useful for analytics
- you mainly need to protect the primary
- query latency is acceptable
- analytical concurrency is not extreme
The architecture stays simpler:
PostgreSQL primary
      │
      └── PostgreSQL read replica
                │
                └── reports / dashboards
This is often an excellent intermediate stage.
But a replica does not change the underlying database engine. If the problem is fundamentally large analytical scans, very high aggregation concurrency, or growing historical workloads, moving those queries to another PostgreSQL node may only move the pressure rather than solve the analytical shape of the workload.
Caching Helps, but It Is Not a Database Strategy
Caching is also useful before introducing ClickHouse.
A dashboard query that is identical for thousands of users may be a perfect cache candidate.
But caches become less effective when every request varies by:
- arbitrary date range
- account or customer
- region
- product
- device
- campaign
- dozens of optional filters
You can end up with millions of possible query combinations and low cache reuse.
Cache the expensive results that naturally repeat. Do not use Redis or another cache as a permanent shield around analytical queries that are fundamentally too expensive for the underlying storage model.
You Probably Do Not Need Kafka Just Because You Need CDC
Another common architecture jump is:
PostgreSQL
   ↓
Debezium
   ↓
Kafka
   ↓
stream processors
   ↓
ClickHouse
That architecture can be excellent when you actually need what Kafka provides:
- many independent consumers
- durable event fan-out
- long replay windows
- stream processing
- event-driven integration across many services
But if the only requirement is:
> “Keep one ClickHouse analytical database synchronized with PostgreSQL.”
then a direct or managed CDC pipeline may be much easier to operate.
Every new infrastructure component creates its own failure modes, upgrades, capacity planning, monitoring, and on-call burden.
Do not build an event platform to solve a replication problem unless the event platform itself provides real value.
A Safer Migration Path
You do not need a dramatic database rewrite.
A practical migration can happen in stages.
Phase 1 — Identify the expensive analytical workload
Collect real evidence. Pick the dashboards or reports that create the most database work.
Phase 2 — Introduce ClickHouse without changing writes
Keep PostgreSQL completely authoritative. Replicate the required data into ClickHouse and validate it in parallel.
Phase 3 — Move only a few analytical reads
Start with queries that:
- are expensive in PostgreSQL
- tolerate eventual consistency
- have clear correctness checks
- are easy to compare between both systems
Phase 4 — Compare results and performance
Track:
query latency
PostgreSQL CPU / I/O reduction
ClickHouse query cost
CDC lag
result correctness
pipeline failure rate
Phase 5 — Expand only if the evidence is good
Move additional analytics gradually instead of deciding in advance that every report must live in ClickHouse.
This keeps the migration reversible and lets the architecture earn its complexity.
When ClickHouse Is Probably Worth It
ClickHouse becomes increasingly attractive when several of these are true:
- large historical tables are scanned frequently
- dashboards run many concurrent aggregations
- analytical query latency grows with data volume
- PostgreSQL CPU or I/O spikes during reporting
- analytics are affecting transactional p95/p99 latency
- product requirements need fast drill-down across large datasets
- high-cardinality dimensions make precomputed dashboards impractical
- reporting windows span months or years
- you expect analytical data volume to continue growing rapidly
Again, there is no universal threshold. The workload matters more than the row count.
When You Should Stay on PostgreSQL
Do not introduce ClickHouse just because it is fast.
Stay with PostgreSQL when:
- analytics remain small or infrequent
- a few indexes solve the important queries
- materialized views are manageable
- a read replica provides enough isolation
- dashboards can be cached effectively
- your team does not want another stateful database to operate
- strong consistency is required for most reads
- the complexity of replication exceeds the performance benefit
A simple architecture that comfortably serves the workload is usually better than a sophisticated architecture searching for a problem.
Operational Checklist
Before calling a PostgreSQL + ClickHouse setup production-ready, make sure you can answer these questions:
- Which database is authoritative for every important entity?
- Which queries are allowed to use eventually consistent data?
- How is CDC lag measured and alerted?
- What happens when replication stops for an hour?
- How are updates and deletes represented in ClickHouse?
- How are historical backfills performed?
- How are schema changes rolled out?
- How do you reconcile PostgreSQL and ClickHouse after an incident?
- Can analytics fall back gracefully if ClickHouse is unavailable?
- Are analytical APIs prevented from accidentally becoming transactional dependencies?
- Can the team rebuild the analytical database from the source of truth if necessary?
The database technology is usually the easy part. Operating the data flow correctly is the real architecture.
Final Takeaway
PostgreSQL does not need to lose its place at the center of an application just because analytics are growing.
Keep it where it is strongest:
transactions
constraints
operational state
strong consistency
application writes
Move analytical workloads only when they have genuinely become a different class of problem:
large scans
historical analysis
heavy aggregations
high-concurrency dashboards
long-range reporting
Then let CDC connect the two systems, keep PostgreSQL authoritative, make replication health observable, and route queries according to consistency requirements rather than convenience.
> Use PostgreSQL for truth. Use ClickHouse for questions about that truth.
That is the useful architecture—not “replace Postgres with ClickHouse,” and not “add more infrastructure because scale sounds impressive.”
The right time to introduce ClickHouse is when it removes a measured analytical bottleneck and the operational cost of running it is lower than the pain it solves.
References

Discussion (0)